
Population Growth
( Sociology Optional)
Introduction
- Population growth is the increase in the number of people in a population or dispersed group.
- Population growth (positive or negative) is caused exclusively by the operation of fertility, mortality, and migration.
- Global human population growth amounts to around 83 million annually, or 1.1% per year.
- The global population has grown from 1 billion in 1800 to 7.9 billion in 2020.
- The UN projected population to keep growing, and estimates have put the total population at 8.6 billion by mid-2030, 9.8 billion by mid-2050 and 11.2 billion by 2100.
The J and S curve of Population Growth
The J curve represents the exponential growth rate of population. The main factors for the J curve growth are:
- The Agricultural revolution, 4000-3000 BC: The settled agriculture and livestock culture led to stable life.
- The Industrial revolution, 18th Century: It led to the mass production and means of subsistence.
- The Medical revolution, 20th Century: It led to increase in the life expectancy.
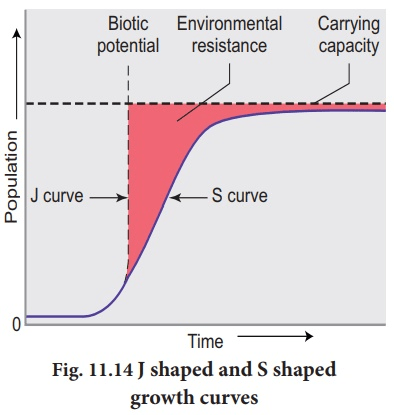
The J-shaped and the S-shaped curves are different in the following ways:
|
J-shaped Curve |
S-shaped Curve |
|
It is the exponential growth of population over time. |
The sigmoid or the logistic growth of population over time. |
|
It occurs when there are plenty of resources. |
It occurs when the resources are limited. |
|
It occurs in two phases- log and lag phase. |
It occurs in lag phase, log phase, deceleration phase and stationary phase. |
|
The stationary is not usually reached. |
The stationary phase is reached. |
|
It takes into account the carrying capacity. |
It does not take into account the carrying capacity. |
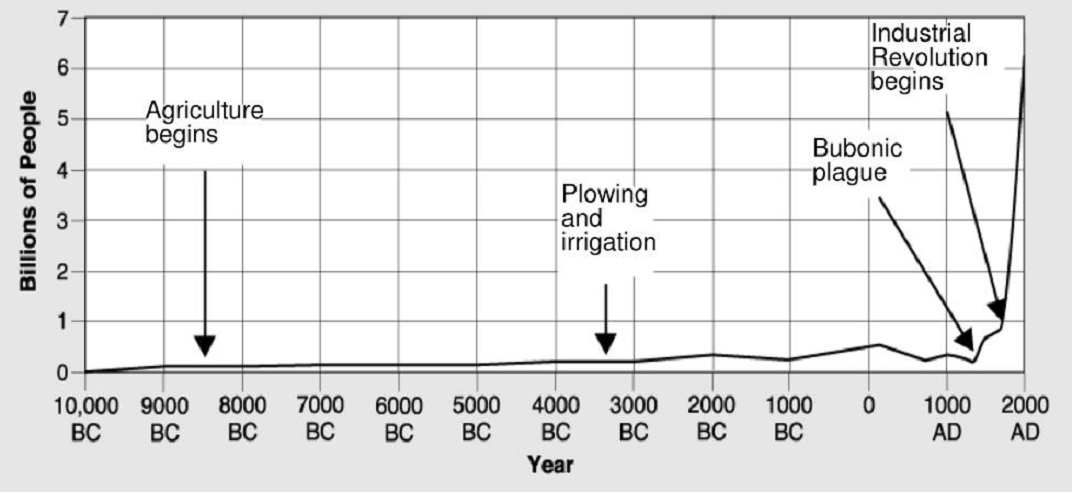
- The population grew very slowly over this long time from 10,000 BCE to 1700 (by 0.04% annually).
- Historical demographers estimate that around the year 1800, the world population was only around 1 billion people.
- After 1800 this changed fundamentally: the world population was around 1 billion in the year 1800 and has increased 7-fold since then.
Theory on population growth
These are already explained in the previous section.
- Malthus’ theory on population growth.
- Demographic transition theory.
- Marx’ theory on population.
- Optimum population theory.
- The Limits to Growth.
Determinants of population growth
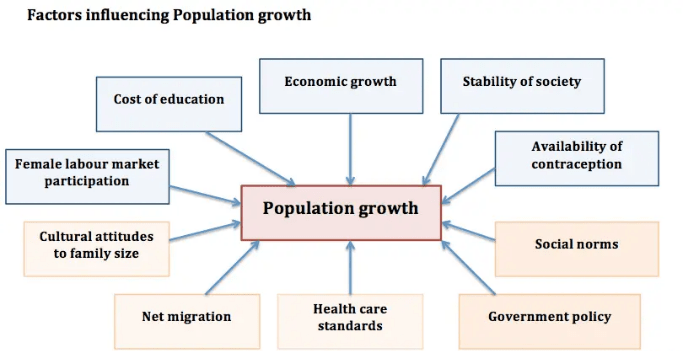
These following factors are explained in the next topic:
- Fertility.
- Mortality.
- Life expectancy.
- Migration.
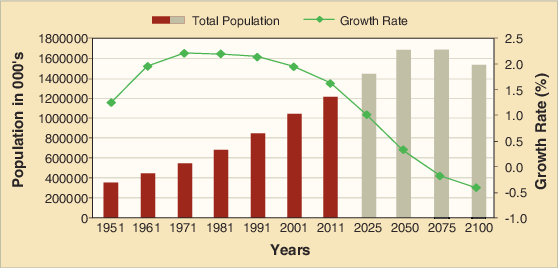
Trends on world population growth
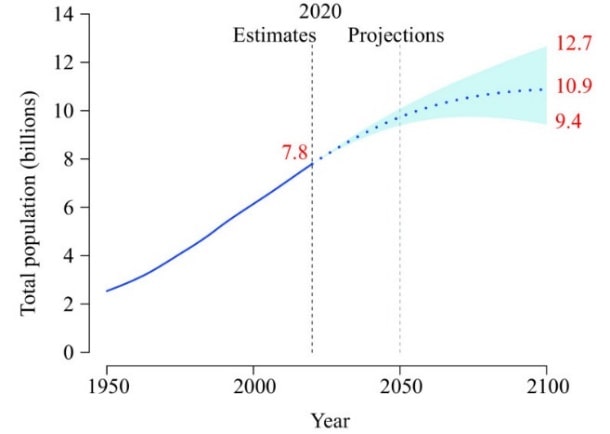
- The world’s population continues to grow, reaching 7.8 billion by mid-2020, rising from 7 billion in 2010, 6 billion in 1998, and 5 billion in 1986.
- The average annual growth rate was around 1.1% in 2015–2020, which steadily decreased after it peaked at 2.3% in the late 1960s.
Trends on population growth of developed countries

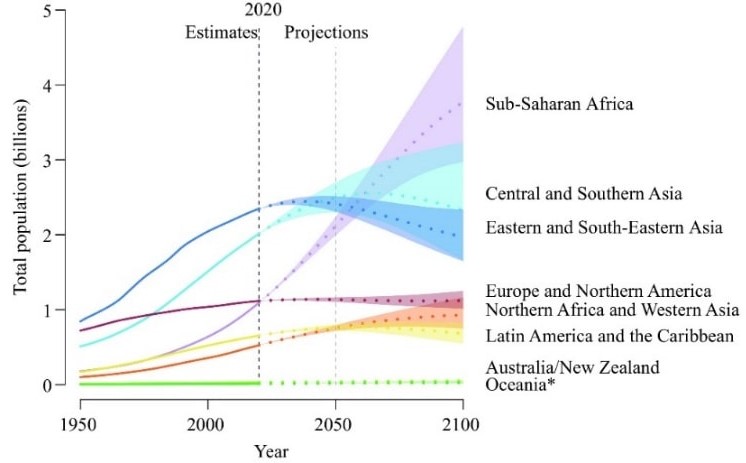
- As per Roland Berger, developing regions will see 97% of the world’s population growth of 1.2 billion people between 2013 and 2030.
- The world’s population is projected to grow to 8.4 billion by 2030, up 18% on the 7.2 billion today.
- Roland Berger finds however that the rate of growth is expected to decrease:
- Annual rate of 1.3% between 1993 and 2013.
- Dropping to annual rate of 0.96% averaged between 2013 and 2030.
- The highest population growth rates will continue to be in developing regions, accounting for 97% of the increase to 2030.
- The biggest reason for the changes is the projected increase in life expectancy combined with lower fertility rates.
- The developing regions will see 1.2 billion people added, a 20.7% increase; while the population of developed countries will increase a mere 3.3%.
- The regions to see the largest increase are India (adding 224.3 million), Nigeria (99.5 million) and China (67.7 million).
- In contrast, the UK will grow by 5.5 million, while Germany will see a decrease of -3.2 million people.
- In the same period the median age will increase to 33.2 years. Net migration too is expected to increase. Cities will become more important as urban areas claim 60% of world’s population.
- There is a difference of more than ten years between the median age in developing and developed regions.
- The median age in developed regions will increase from 40.5 year to 43.7 years and in developing regions from 27.2 years to 31.2 years.

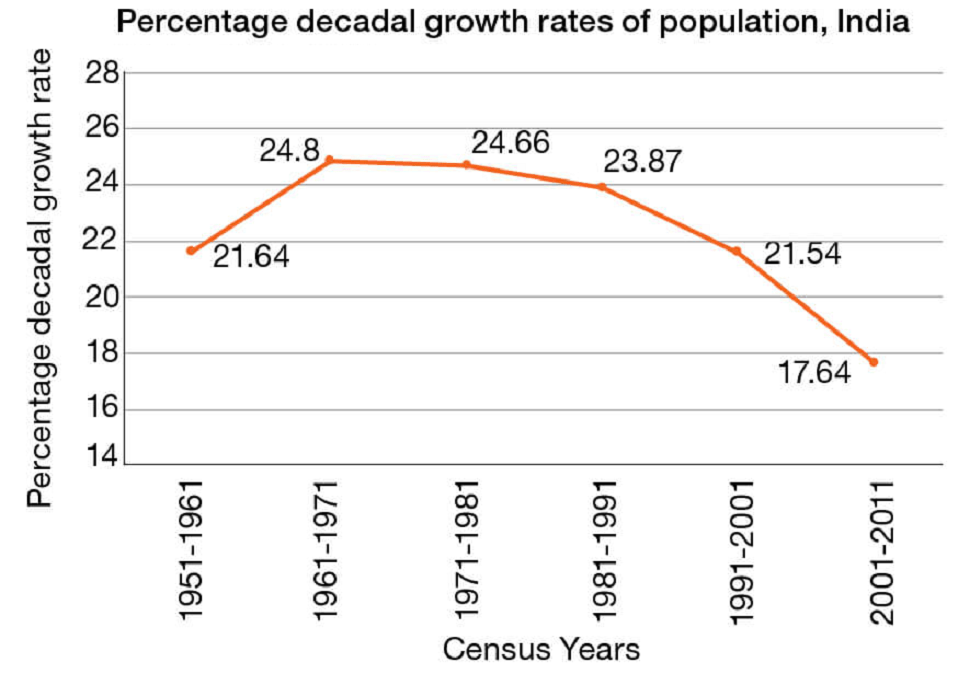
Phases of population growth in India
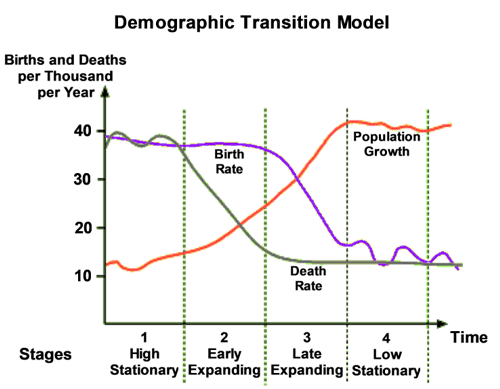
India’s population growth during twentieth century can be chartered and classified into four distinct phases of the demographic transition.
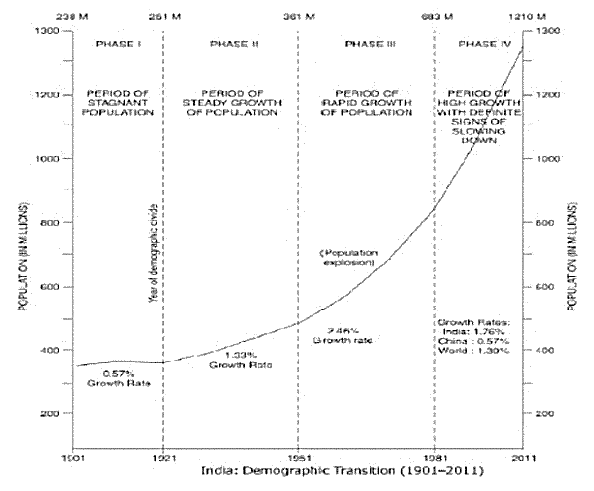
These phases can be compared with the four stages of the demographic transition theory.
Phase 1 (1901-1921)- Period of stagnant population
- The period from 1901-1921 is referred to as a period of stagnant or stationary phase of growth of India’s population, since in this period growth rate was very low, even recording a negative growth rate during 1911-1921.
- Both the birth rate and death rate were high keeping the rate of increase low.
- Poor health and medical services, illiteracy of people at large and inefficient distribution system of food and other basic necessities were largely responsible for a high birth and death rates in this period.
Phase 2 (1921-1951)- Period of steady growth
- The decades 1921-1951 are referred to as the period of steady population growth.
- An overall improvement in health and sanitation throughout the country brought down the mortality rate.
- At the same time better transport and communication system improved distribution system.
- The crude birth rate remained high in this period leading to higher growth rate than the previous phase.
- This is impressive at the backdrop of Great Economic Depression, 1920s and World War II.
Phase 3 (1951-1981)- Period of rapid population growth
- The decades 1951-1981 are referred to as the period of population explosion in India, which was caused by a rapid fall in the mortality rate but a high fertility rate of population in the country.
- It is in this period, after the Independence due to centralized planning and improved economic conditions there was a high natural increase and higher growth rate.
- Besides, increased international migration also contributed to the high growth rate.
Phase 4 (1981-2011)- Period of high population growth rate with a definite sigh of slowing down
- In the post 1981 till present, the growth rate of country’s population though remained high, has started slowing down gradually.
- A downward trend of crude birth rate is held responsible for such a population growth.
- This was, in turn, affected by an increase in the mean age at marriage, improved quality of life particularly education of females in the country.