ACF and AKF Diagrams
ACF and AKF Diagrams
ACF diagrams
- The diagram of ACF was given by Eskola in 1915 for the study of metamorphic rocks.
- It is the three-component diagram formed in triangle shape helps in exhibiting the metamorphic mineral assemblages within metamorphic facies.
- The diagram concentrates on the minerals which appears and disappears during the metamorphism. Thus they indicate the specific metamorphic grade.
- As sodium and potassium are found in mafic rocks along with the composition of aluminium thus forming minerals such as K-feldspar and albite.
- In the diagram of ACF the main focus is given on K-bearing metamorphic minerals and the amount of Al2O3 which occurs in excess but in combination of Na2O and K2O.
- The ratio between Al2O3 and Na2O and K2O is 1:1
- There is also the elimination of water and silica is also ignored by Eskola in the diagram just because water is assumed to be formed everywhere and silica is thus equivalent to quartz.
- Those minerals which are coexist in equilibrium are represented by tielines.
Plotting a rock on the ACF diagram
- To plot a rock on the ACF diagram, the chemical analysis of the rock is first recalculated to molecular proportions by dividing the molecular weight of each oxide constituent by the molecular weight of that oxide.
- Major oxides found in metamorphic rocks : SiO2 ,Al2O3, CaO, FeO, MgO, and K2O
- Major components of ACF diagram:
- A = Al2O3
- C = CaO
- F = FeO + MgO
- However, the A value we want is the value of excess Al2O3left after allotting Na2O and K2O to form alkali feldspar. Na2O and K2O has been subtracted in component A.
- The CaO value we want is the excess CaO after allotting P2O5to form apatite, assuming that any P2O5 in the rock will suck up CaO to form apatite.
- We assume that all mineral assemblages plotted may also contain alkali feldspar and quartz.
- So, to obtain the plotting parameters, we calculate a, b and c, where the bracket symbols [ ] indicate the molecular proportions of the oxides.
- a = [Al2O3+ Fe2O3] - [Na2O + K2O]
- c = [CaO] - 3.33[P2O5]
- f = [FeO + MgO + MnO]
- Since we are only plotting these 3 components, they have to be normalized so that they add up to 1 (or 100 if we are plotting %).
- if t = a + c + f, then the plotting parameters are:
- A = 100 * a/t
- C = 100 * c/t
- F = 100 * f/t
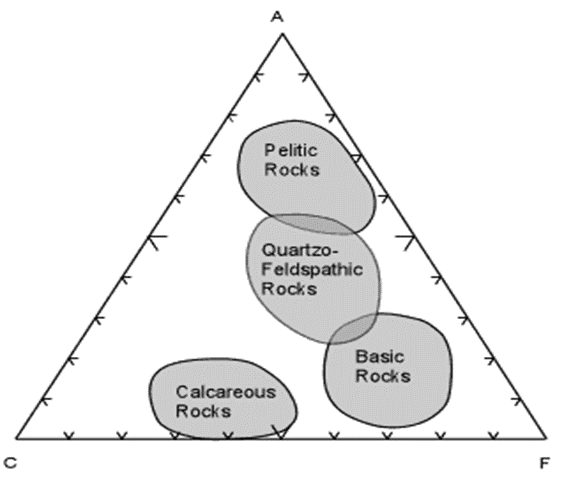
- When these calculations are done for a wide variety of rock compositions and grouped as pelitic, quartzo-feldspathic, basic, and calcareous, the fields are as shown here.
- Most shales will plot in the field of Pelitic Rocks. Quartzo-feldspathic rocks like feldspathic sandstones, granites, and rhyolites will plot in the Quartzo-Feldspathic field. Basic igneous rocks, like basalts and gabbros will plot in the field of Basic Rocks, and siliceous limestones and dolomites will plot in the field of Calcareous Rocks.
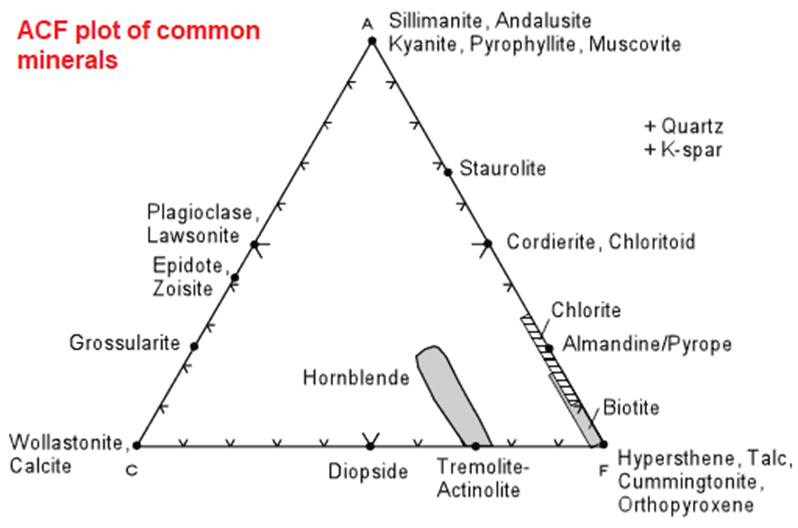
- Plotting minerals on the ACF diagram is somewhat easier if you know the chemical formula of the mineral, since mineral formulae are already in the form of molecular proportions. Thus for a mineral like hypersthene, (Mg,Fe)SiO3, we have 1 molecule of (FeO + MgO) for every 1 molecule of SiO2. Thus:
- a = 0
- c = 0
- f = 1
- t =1
- so, the plotting parameters become
- A = 100 * 0/1 = 0
- C = 100 * 0/1 = 0
- F = 100 * 1/1 = 100%
- and we see that hypersthene would plot at the F corner of the ACF diagram.
AKF diagrams
- As the pelitic sediments consist of high amount of Al2O3 and K2O and low in CaO, Eskola proposed an diagram which included K2O to depict the mineral assemblages that develop in them.
- In AKF diagrams, we assume that both alkali feldspar and plagioclase feldspar can be present. Thus, the excess Al2O3amount is used, which is left after allotting it to all of the feldspars.
- Metapelites consist of major minerals such as andalusite, muscovite and microcline marked in the diagram.
- Al that occurs in excess of that combined with K, Na, and Ca in order to make any feldspar.
- No plagioclase plots on the AKF diagram have been seen.
- Al:Ca ratio in anorthite has been seen as 2:1 so the only one atom of Ca is subtracted from two of Al
- Eskola used this diagram in order to study the paragenesis of pelitic hornfels in Finland.
- Andalusite and muscovite plotting is as the same point as there in the ACF diagram, and microcline doesn’t plot at all thus making the ACF diagram much less useful for pelitic rocks that are rich in K and Al.
- AKF diagram is mainly useful for metamorphosed granitoid rocks and some meta-graywackes.

Plotting a rock on the AKF diagram
- To obtain the plotting parameters for ACF diagrams, we calculate the following components:
- a = [Al2O3+ Fe2O3] - [Na2O + K2O + CaO]
- k = [K2O]
- f = [FeO + MgO + MnO]
- Let t = a + k + f, then the plotting parameters in % are:
- A = 100 * a/t
- K = 100 * k/t
- F = 100 * f/t
Minerals are plotted in the same way as was done for the ACF diagrams. The following AKF diagram shows the potting positions of common metamorphic minerals.
We take the chemical formula of K-feldspar KAlSi3O8 and rewrite it in oxide form as 1/2K2O 1/2Al2O3 3SiO2. Then:
- a = ½ - ½ = 0
- k = ½
- f = 0
- t = ½
So,
- A = 100 * 0/½ = 0%
- K = 100 * ½ /½ = 100%
- F = 100 * 0/½ = 0%
Note that AKF diagrams are used for CaO-poor, K2O-rich rocks, whereas ACF diagrams should be used for Al2O3 and CaO - rich rocks.
AFM Diagram
- One of the problems associated with ACF and AKF diagrams is that Fe and Mg are assumed to substitute for one another and act as a single component. We know, however, that in natural minerals the composition of Fe - Mg solid solutions is very much dependent on temperature and pressure. Thus, in treating Fe and Mg as a single component, we lose some information.
- Thompson developed a projected diagram that takes into account possible variation in the Mg/(Mg+Fe) ratios in ferromagnesium minerals, and has proven very useful in understanding metamorphosed pelitic sediments.
- Starts with the 5 component system SiO2 - Al2O3 - K2O - FeO - MgO and ignores minor components in pelitic rocks like CaO and Na2O. Because quartz is a ubiquitous phase in metamorphosed pelitic rocks, the five component system is projected into the four component system Al2O3 - K2O - FeO - MgO as shown below.
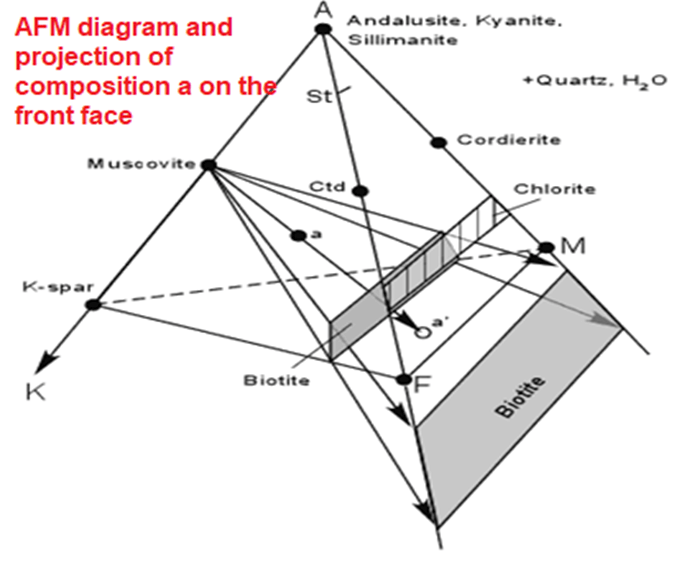
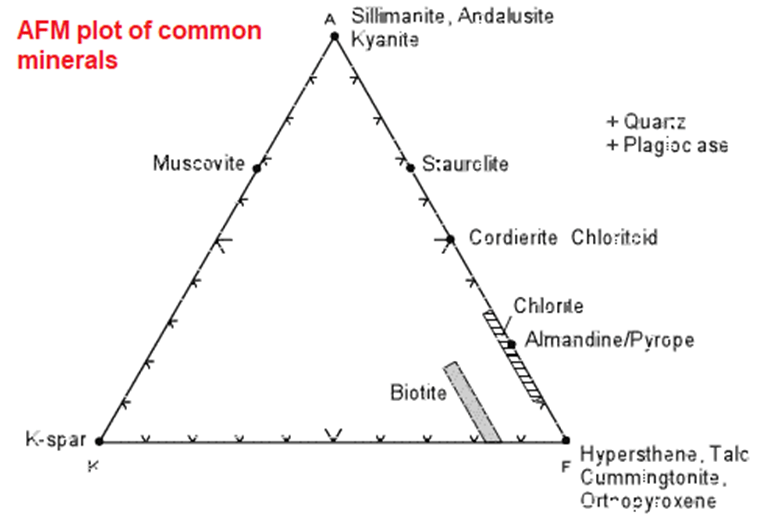
- because muscovite is also a common mineral in these rocks, all compositions are projected from muscovite onto the front face of the diagram. (Al2O3 - FeO - MgO). The front face of the diagram becomes the AFM diagram.
- Minerals that contain no K2O like andalusite, kyanite and sillimanite plot at the A corner of the diagram, and minerals like staurolite, chloritoid (Ctd), chlorite, and garnet plot on the front face of the diagram.
- Biotite, however, does contain K2Oand has varying amounts of Al2O3and thus is a solid solution that lies in the four component system. Because muscovite is relatively K - poor, this results in biotite being projected to negative values of Al2O3.
- To calculate the plotting parameters for the AFM diagram the following formulae are used:
- A = [Al2O3- 3 K2O]
- F = [FeO]
- M = [MgO]
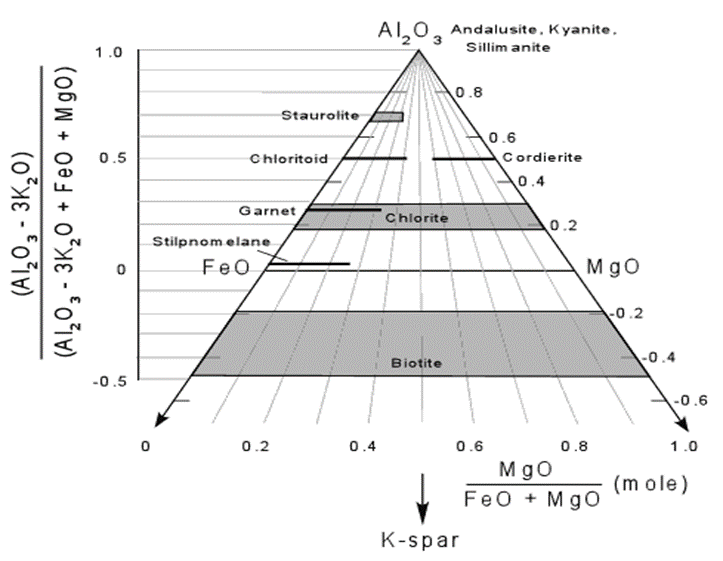
- Using these parameters, one can grid off the AFM diagram with the vertical scale represented by the normalized values for the A parameter –
[Al2O3 - 3 K2O]/[Al2O3 - 3 K2O + FeO + MgO]
and the horizontal position based on the ratio of MgO/(FeO + Mg) as seem below.